2025 has passed months ago. I have not taken the time to evaluate the performance of my energy consumption goals.
The situation also didn’t change that much compared to previous year.
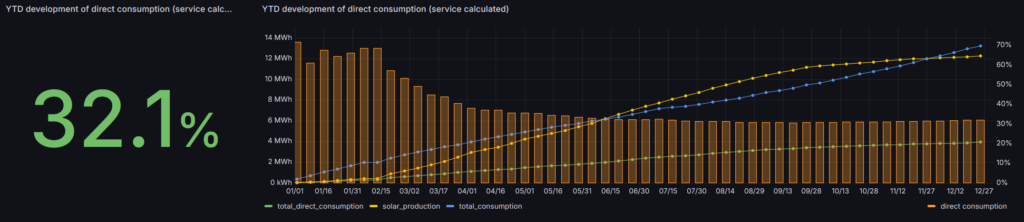
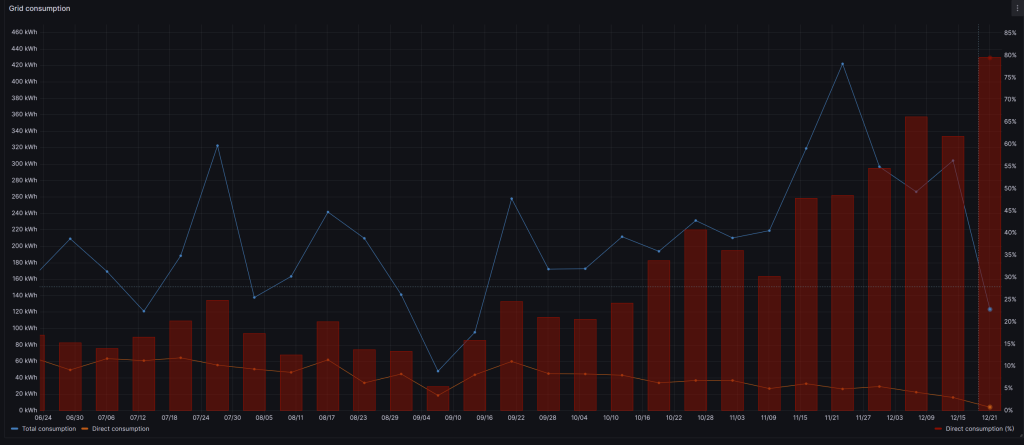
I closed the year with a direct consumption of 32.1%. This is very close to the 34.1% of 2024. I’m far away from my goal of 45%. Unfortunately this looks like this is the best I can do based on my current technical set-up and consumption patterns.
Let’ have a look at the car charging and heatpump planning numbers.
Car charging
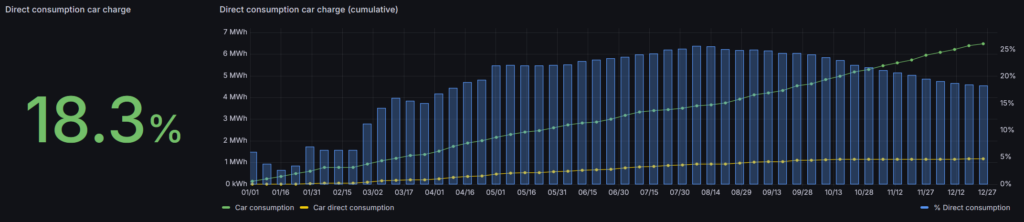
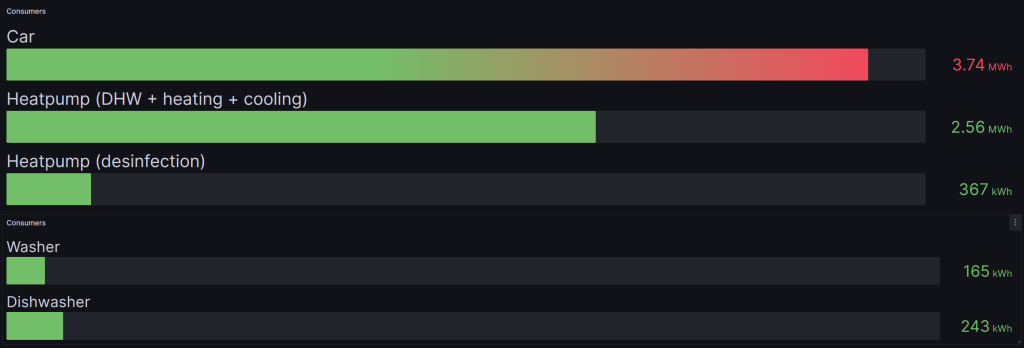
This is where things went “wrong”. In total the car consumed 6400kWh in 2025, which is more or less the same as 2024. 1171kWh was produced by solar energy, compared to 1730kWh (26.1%) in 2024.
We are using the car during the day and therefore need to charge it during the night. There is little more to improve here, other than postponing the charge as much as possible when we know we don’t have to use the car the next day.
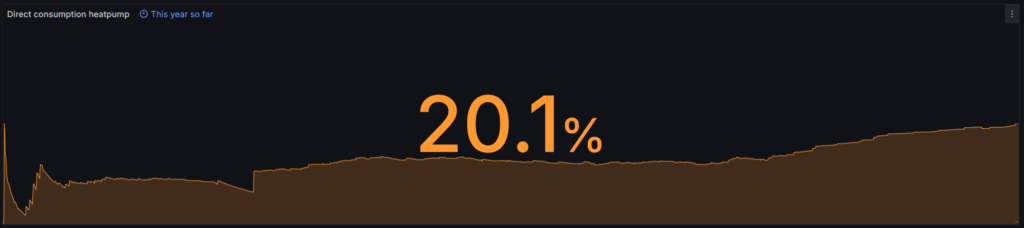
Heatpump planning
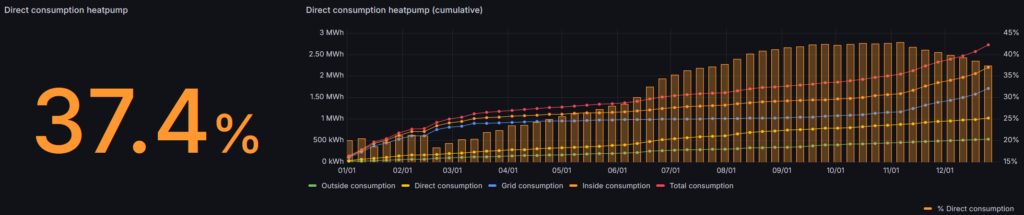
Finally some good news! In total the heatpump consumed 2724kWh (2596 degree days) over 2025 (compared to 2650kWh in 2024, 2426 degree days). The direct consumption went up from 27.9% in 2024 to 37.4% in 2025.
The algorithm changes in the last part of 2025 seem to have worked over 2026. I’m curious to see how this will develop over to 2027.
Overview
I need to look into the 8% drop of direct consumption by the car, and the limited impact on the total direct consumption (even though the car is contributing to roughly 50% of our entire consumption).
Year
Direct Consumption
Car
Heatpump
2023
19%
n.a.
n.a.
2024
34%
26%
28%
2025
32%
18%
37%
Looking forward
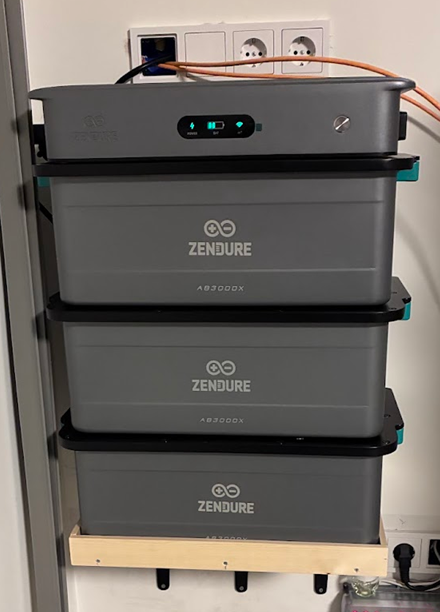
I’ve kept an eye on these number during 2025 and already concluded I’ve reached the limits of the current way of working. I started to consider purchasing a home battery in October. I was hoping to find a 3-phase system that would be able to flexibly deliver energy on all three phases. I couldn’t find a system what would be able to do this. My next chain of thought was to purchase three 1-phase systems, but that would mean an investment of over 10.000 EUR on technology of which I don’t know if it helps me to achieve my goals and how long it will last.
Eventually, I decided to purchase one 1-phase system with roughly 9kWh of capacity: the Zendure AC2400 with three batteries.
They had a good end of the year deal and after some fiddling around with their API I managed to integrate the system into the digital twin of my house. As it’s a 1-phase system I’m just looking at the total consumption and delivery of the 3-phases. The battery charging strategy works based on the EPEX energy price and the predicted amount of solar energy for the upcoming day. If the amount of solar energy is large enough, it waits until the peak moment of the day and then starts charging at full speed. When the difference between the highest and lowest energy price meets a certain threshold, it charges at full speed during the lowest point. Last, when predictions are bad, it just prevents energy from being delivered back to the grid.
For now this is working, but I’m sure I will need the rest of 2026 to optimize the charging and discharging strategy. I am already seeing an impact on my energy dependency but I still need to analyze the data and think of a good KPI to monitor the progress.
Based on the technical architecture of my digital home I’m currently running 42 micro-services. Each micro-service has a special role in our daily lives. This article provides an overview of the use-cases that these micro-services enable.
I have multiple goals with these use-cases:
Comfort: automating daily routines, especially the ones that are highly repetitive and require extensive steps;
Reducing energy cost: we have a fully electric house (with the exception of the second car) and consume a lot of energy. Prices are dynamic and with planning our consumption we can reduce our energy cost;
Reducing grid load: we are living in an electrified environment (with the exception of the second car) and consume a lot of energy. We try to consume energy outside of grid congestion hours (between 16.00 and 21.00) and take the availability of solar energy into account.
It's important to understand I'm using a price index to select the best moment of the day to consume energy. I calculate the price index based on the EPEX energy prices and the expected amount of solar energy.
Heating optimization: when winter comes I calculate the expected number of hours the heatpump requires to keep our home comfortable. Based on the energy price index the heatpump is switched on. Additionally, when a lot of sun is expected heating is disabled and the sun heates up our home during the morning, sometimes reaching a comfortable 21C when it’s freezing outside;
Hot water optimization: hot water generation is planned based on the current water temperature and the energy price index;
Ventilation optimization: we have six CO2 sensors in our home. The ventilation system is controlled based on the input of the CO2 sensors. The ventilation slows down when we are not at home to save energy in the ventilation system itself as well as heating losses;
Car charging planning: car charging is planned based on the planned time to leave the next day, battery charge state and the energy price index;
Appliance planning: the dishwasher, washer and dryer programs are planned based on the time of the day the program is being started and the energy price index;
Security alarm system: the security alarm system is automatically armed when we leave. Camera snapshots are send to our mobile devices when the virtual perimeter alarms are triggered, motion detectors are triggered, or when persons approach the front door;
Light control: lights are automatically controlled based on the time of day, position of the sun (season), motion detectors, and state of the security alarm system;
Solar screen control: solar screens are automatically controlled based on the weather predictions and inside temperature;
Beer/drinks fridge control: our outside fridge only turns on on Friday, Saturday and Sunday when temperatures reach over 20C and sun is expected;
Radio automated start: this was an annoyance: the radio is automatically started when the Chromecast comes online. No more apps to manually control the radio. In the weekend another radio channel is selected to switch from working to weekend mode;
Energy monitoring: 50 energy monitoring sensors ranging from the consolidate building energy consumption, freezer, fridge, lighting, car, heatpump, solar panels, TV and IT equipment.
Automatically turn off solar energy production when energy prices are negative;
I still have a short “wish” list:
When financially sound introduce a battery in the environment to further reduce energy consumption from the grid;
Keep an eye on traffic speed on the main road next to our house;
In general I’m in an optimization phase. Most use-cases are up and running and require regular tweaking and fine-tuning. Sometimes optimization means taking 10 minutes to change an algorithm and push the micro-service into production. Sometimes it means two weeks of (evening) work to fundamentally change the architecture of a use-cases. It’s a hobby project, it keeps me from the street and challenges my technical skills.
In October 2024 I analyzed the data YTD: Minimizing grid consumption (2). In the days after NYE I had another look at the data and noticed some irregularities. The algorithm that calculated the direct consumption percentage didn’t match with the values registered by my energy meters. I updated the algorithm and recalculated the data from 2024 to make it consistent with the values registered by the energy meters.
The good news is that things look better compared to analysis I did in October:
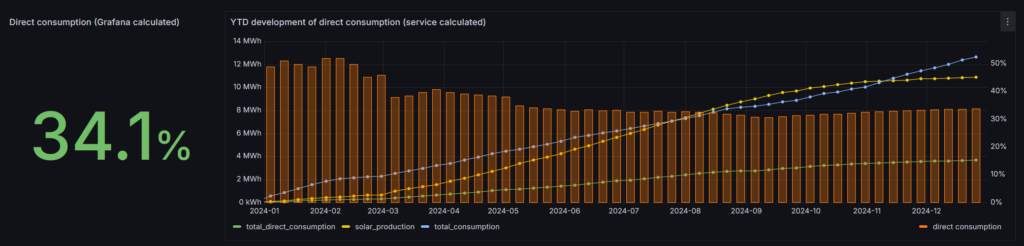
I closed the year with a direct consumption of 34.1%. This is a huge leap forward from the 19% in 2023! However, unfortunately I did not achieve my goal (40%).
First things first: where is the improvement coming from? As I mentioned in the previous blog, I spend my time on improving two things: car charging and heatpump planning.
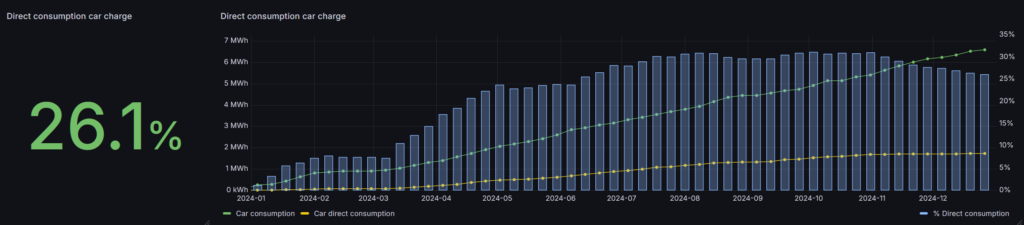
Car charging
In total the car consumed roughly 6400kWh in 2024, of which 1730kWh were produced by solar energy.
(The “bump” in March was related to a service outage during our vacation and a correction of three weeks of missing data)
At this moment I’m planning the charging of the car based on an ON/OFF mechanism. The car is charged when most solar energy is expected. Then it will charge at 11kW (full speed). What I can still improve is to take the amount of expected solar energy into account, and adjust the charging speed accordingly. This will lengthen the charge and spread it out over the day, and probably result in a higher direct consumption, especially in the summer months.
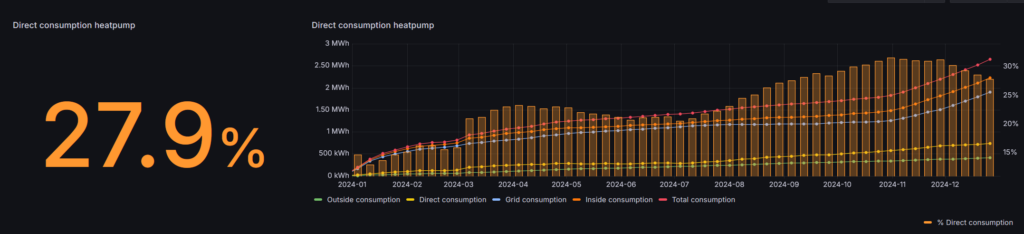
Heatpump planning
The planning of the generation of domestic hot water was already operational for a longer time. I improved some small things in the algorithm, for example, setting the maximum power consumption of the boiler at disinfection runs depending on the availability of solar energy.
In total the heatpump consumed 2650kWh in 2024, of which 739kWh where produced by solar energy.
(The “bump” in March was related to a service outage during our vacation and a correction of three weeks of missing data)
In the last months of the year I made some minor adjustments to the planning of heating the house. As the isolation of our house is modern I can turn off the heatpump for a couple of hours without noticeable impact on the inside temperature. I’m reducing the set temperature during the night and turn off the heatpump during the six hours the EPEX energy prices are at their peak. As the heatpump is consuming a lot of energy during the winter period, when there isn’t a lot of solar energy anyway, I don’t think this will actually contribute to my main goal.
Conclusion
Unfortunately I wasn’t able to achieve my target, but I made a good step in the right direction. I made some small adjustments to the goals, hoping I can still achieve 50% direct consumption without using a battery system. As the “salderingsregeling” will end in 2027, it should still give me enough time to evaluate if there is a need for a battery system before 2027 starts.
Last year, I described my view on home energy consumption and my personal goals here: minimizing grid consumption.
Today, the summer of 2024 has passed and we’re moving into the “dark” season. It’s time to look ahead towards the end of the year, look back at my previous goals and adjust them where necessary.
Before we do that let’s have another look at my ambitious goals for the next years:
Year
Grid consumption
Direct consumption
2023 (today)
80%
20%
2024
60%
40%
2025
53%
47%
2026
50%
50%
Overview of yearly goals to reach my vision in 2027 (defined in December 2023).
Status quo
At the end of 2023 roughly 20% of the energy we consumed was directly consumed from our solar panels. Today, in the beginning of October 2024, our direct consumption of the year 2024 (year-to-date) is 28.4%.
A weekly overview of the direct consumption (0-100%).
The start of the year seemed good. However, in the beginning of the year the solar panels deliver less energy compared to the summer months, so the direct consumption is higher in the “dark” months. In the end, I’m far away from the 40% I was hoping to achieve this year.
Changes
This was not totally unexpected, but still a bit of a disappointment. Especially considering the changes I’ve worked on during the year:
Introduction of a price index
I was already monitoring the epex-spot prices and predicting the production of solar energy. I used both data points to schedule energy consumption, but the algorithm was (too) complex to maintain and wasn’t always showing optimal results. I’ve created a price-index that combines the epex-price and expected solar production into a single value.
Energy planning using the price index
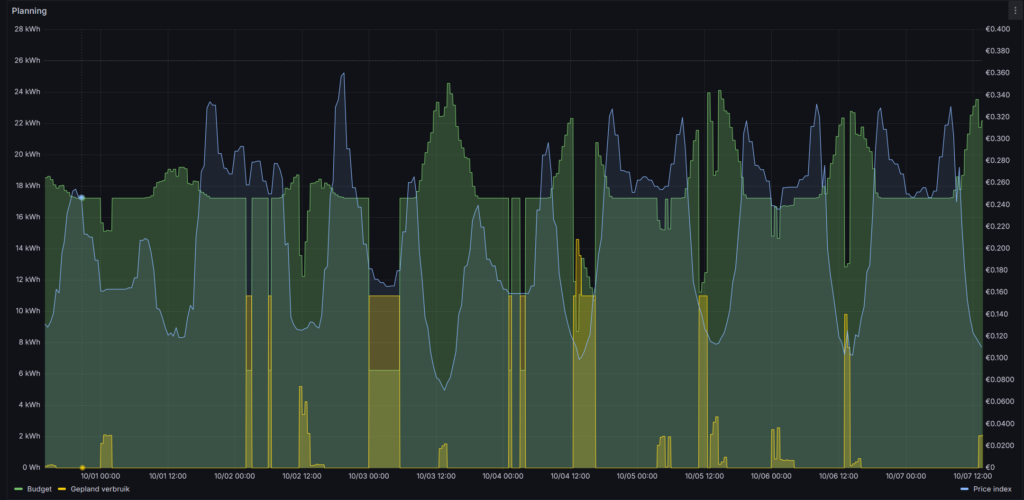
To use the price-index I needed to adjust the scheduling process. This was a difficult change because appliance specific micro services where doing their own planning. This meant I needed to change the “controllers” for the HomeConnect appliances, heatpump and car. I took this as an opportunity to create a separate scheduling micro service. The controllers now request the scheduling service for the best time to start a appliance specific program. The scheduler calculates the best start time based on the expect program duration, consumption and time to complete. The image below visualizes the result of the new scheduler process. Most programs are scheduled during the daily solar peak, when the price index is at it lowest point. However, when I get home from work at the end of the afternoon, and need to start driving early morning again, the scheduler uses the price index to chose the best time to charge the car during the night.
Visualization of the planning process: (green) available energy grid+solar; (blue) price-index; (yellow) planned energy consumption.
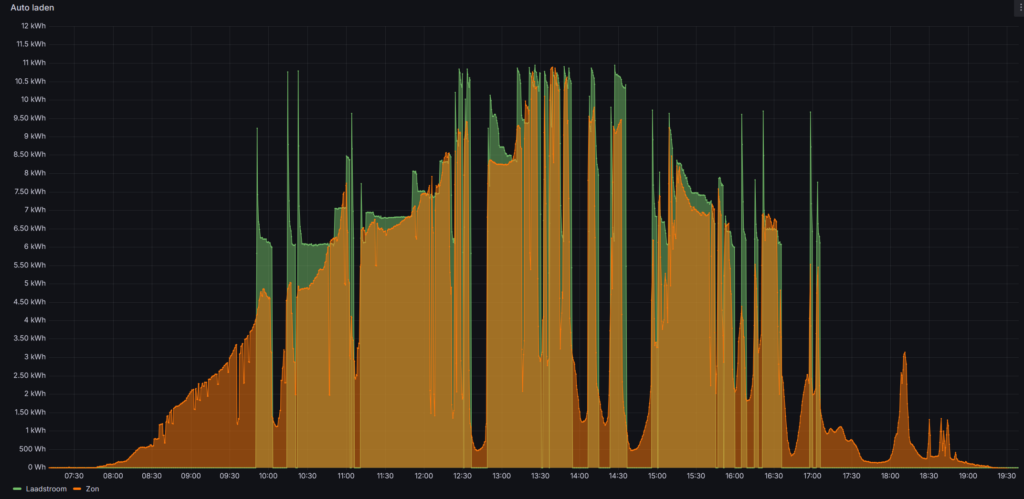
Unplanned car charging
When I don’t know when I need the car I just connect it to the socket. The controller then considers the actual solar production and redirects this energy to the car. To ensure a stable charging process I needed to build in some delays. The curve is not perfect, but I think it’s close enough.
(Orange) solar production; (green) car charging.
There is some discussion on the impact of the power quality of “smart charging”. I need to understand this a bit better and probably need to adjust my algorithm.
What’s going on?
Why am I stuck at 28%? To answer this question I need to look at the two largest consumers: the car and the heatpump.
Car
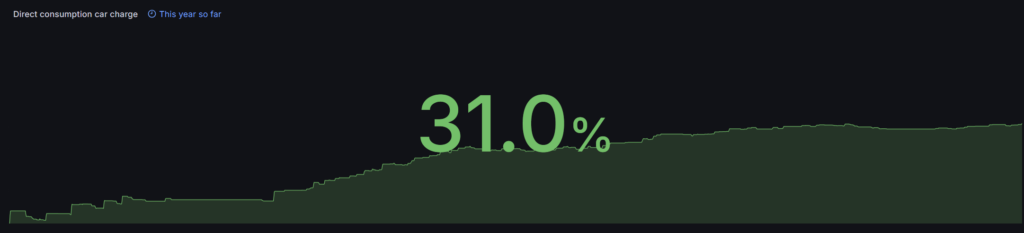
Let’s start with the car: the direct consumption of the car is 31%. It will be very difficult to further improve this, as it’s depending on a combination of my work schedule and the weather. The situation has improved since the beginning of the year. I’m expecting the year end to be difficult as the solar production will go down in the last months of the year. I might be able to find small optimizations in the scheduler over the next months.
31% of the car energy consumption is coming from solar production.
Heatpump
The heatpump is even more complex as it uses two energy sources (the compressor and the COP1 heater) and has three different goals: heating, cooling, and domestic hot water. For this analysis I have only looked at the difference between the compressor and the COP1 heater.
The digital twin of the heatpump was already operational at the end of 2023. It gives me full control of when domestic hot water, disinfection, heating and cooling are enabled.
Digital twin of the heatpump
I’ve started to work on a couple of things:
Detailed planning of the generation of domestic hot water;
Detailed planning of the disinfection process (to prevent bacteria);
Reducing the operation hours of the heating and cooling process.
The domestic hot water is now only generated during the day, based on the price index. The scheduler does not wait until the hot water is “empty”, but starts generating hot water if it expects a sunny day to generate a buffer for the day after.
The disinfection is typically planned once a week. I needed to add a bit of slack and, depending on the predicted availability of solar energy, it now schedules the best time to run a disinfection run between 6-9 days after the last run. Additionally, the power of the disinfection is adjusted based on the maximum available solar energy. If a maximum of 3kW of solar energy is expected, the disinfection power is adjusted down from 9kW to 3kW, it’s lowest value. The disadvantage is that disinfection takes longer, but that has not proven to create new problems.
Last winter, the heatpump was running the entire night to heat the house. Then, on sunny days, the sun started heating up our living room through our glass “walls” resulting in an inside temperature of 25 degrees Celsius. The energy consumed by the heatpump in the night and morning was, more or less, wasted. The controller now looks at the predicted temperature and solar radiation of the upcoming day and only turns on the heatpump if a combination of a low temperature and low sun radiation is expected. Cooling is only enabled if the inside temperature reaches a configured threshold. This mechanism should prevent wasted energy, but is not optimized for generating heat a the best time of day.
This has resulted in 20% direct consumption, which is far from the target.
Direct consumption of the heatpump 2024 YTD.
The largest problem is the heating in the winter. There is no solar energy produced so the direct consumption is low.
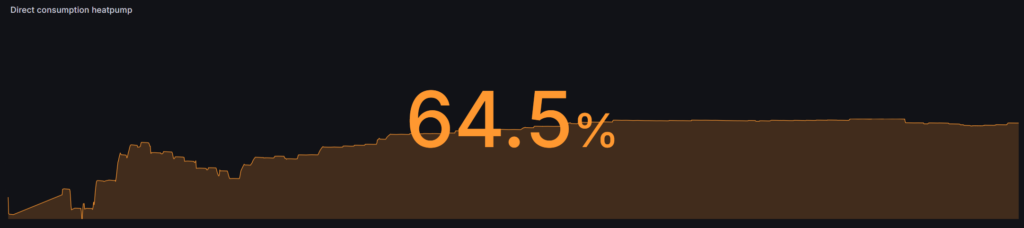
When I only look at the direct consumption over the last 90 days (7 Juli – 7 October) the situation looks a lot better.
Direct consumption of the heatpump over the last 90 days.
Conclusion
I don’t think the 40% direct consumption target is realistic for 2024. I probably need another year to come to 40%.
Over the next months I need to start understanding in which situations the heatpump is consuming energy from the grid. Additionally, I will slowly start looking into the consumption and planning of the WTW (ventilation) unit, fridge, and freezer. At the same time I need to prevent the risk of food poisoning by (control) software failure.
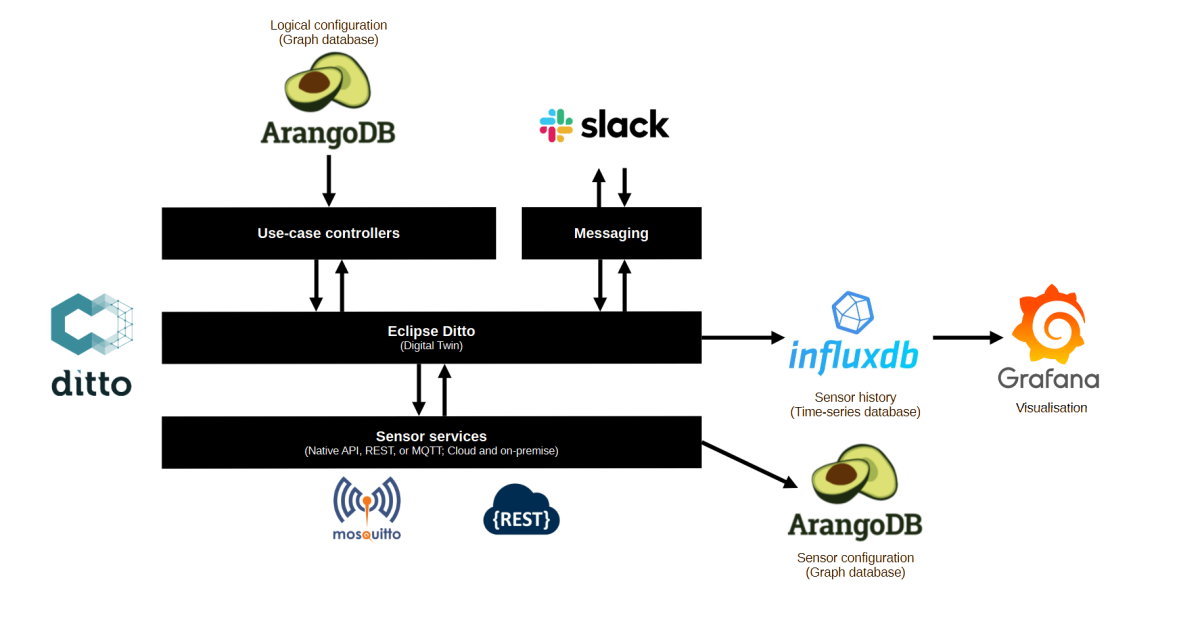
This article describes the components that build up the architecture of my (digital) home.
Logical configuration (ArangoDB): the logical configuration includes the areas (rooms) in the house, the sensors and actors located in those areas, and the “scenes” that can be applied to actors and areas.
Use-case controllers (custom .NET Core worker services): I’ve build a separate micro service for each use-case, for example, controlling lights, planning washer, dishwasher, and dryer, and planning the generation of domestic hot water.
Digital Twin (Eclipse Ditto): the Digital Twin stores the state of all connected sensors and is used by the use-case controllers to consume sensor states or push commands back down to the sensors.
Messaging (Slack): I’m using Slack as a messaging service to interact with my home. Slack informs me on specific state changes in the Digital Twin and I can feed commands in Slack to influence the behavior of my home. I try to minimize this as most decisions should be fully automated.
Sensor services (custom .NET Core worker services): the sensor services read sensor states via open or proprietary protocols. They are also responsible for pushing commands down to actors.
Sensor history (InfuxDB): InfluxDB stores the (relevant) history of the Digital Twin as well as the history from the different energy services that feed directly into InfluxDB.
Sensor configuration (ArangoDB): ArangoDB stores the information needed to communicate with local and cloud-based sensors.
Visualisation (Grafana): I’m using Grafana as a visualisation front-end.
Visualization of the architecture of my digital home.
Roughly 20% of Dutch homes is equipped with solar panels. In Germany the adoption rate of solar panels is roughly 11%. This means that these homes produce power locally, but they hardly use it at the same time when it’s being produced. Only 30% of the produced energy is consumed directly. That means that 70% of the energy consumption is still consumed from the grid.
Metrics
Considering my own installation the numbers are even worse. Only ~20% of the locally produced (10mWh) energy is directly consumed (2Mwh). The real problem is that almost 80% of the consumed energy is consumed from the grid.
Vision
In 2026, three years from now, I want to reduce my grid consumption to 50% (on average, per year).
I have no idea if this is achievable, but it’s good to have a concrete goal. If I figure out I can achieve this in one year, I will increase my ambition.
In order to achieve this vision, I need to increase the direct consumption which will result in a decrease of overall grid consumption.
Steps along the way
To reach this vision, I need to understand at which times energy is already directly consumed and which consumers are causing this consumption. Additionally, I need to understand when energy is consumed from the grid and which consumers are causing this consumption. I’m hoping that, by influencing the consumption patterns of the largest consumers, I can make the first large step.
Year
Grid consumption
Direct consumption
2023 (today)
80%
20%
2024
60%
40%
2025
53%
47%
2026
50%
50%
Overview of yearly goals to reach my vision in 2027.
I expect that the first major improvements will already start paying off in 2024. I’m aiming for a 20% increase in 2024 over 2023. Then the real challenge will probably start.
First analysis of available data
In the first half of the year my system was still in development. After that is has become more stable, which resulted in a stable data collection since June.
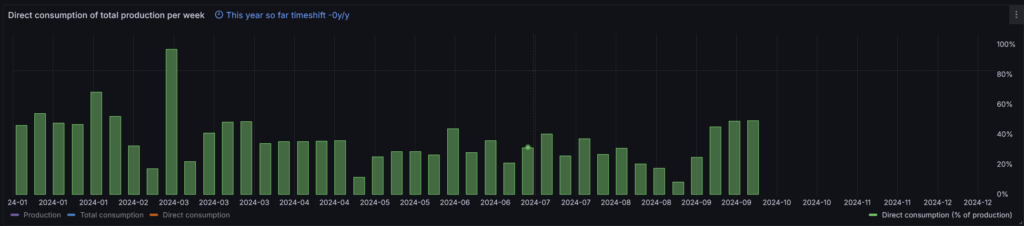
When is direct consumption low?
At this moment I considered one interesting data points per week:
Direct consumption (%) = direct consumption / total production (solar);
The direct consumption (%) in red per week. It’s clearly visible that when the solar production goes down in the winter months, the direct consumption goes up.
Considering the available data I should start trying to focus on the summer months when solar production is high.
Which are the largest consumers?
Let’s have a look at the usual suspects fist: the car, heatpump, washer, and dishwasher.
The car takes roughly 35% of the yearly consumption. The (combined) heatpump follows with 28%.
Next steps
Considering my vision and the available data I should focus on moving grid consumption for the car and heatpump to direct consumption, especially in the summer months. I will share concrete objectives and key-results for this in a next post.
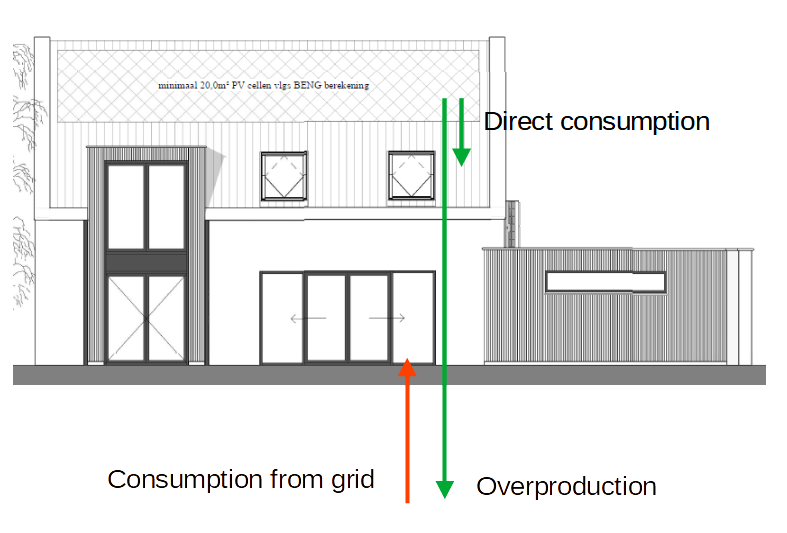
One of the goals of building a digital twin of our house is to reduce our dependence on external energy sources. To achieve this goal, and to validate if my measures are having a positive effect, I need to compute our dependence on external energy sources. Our house will be fully electric, so that makes things a bit easier as I don’t have to take gas into account.
Basically, we will have two sources of energy (the grid and the PV (solar) panels) and one consumer: the house itself, including all the appliances consuming energy.
Energy situation of our future house.
External energy, in this context, is energy consumed from the grid. I calculate the total amount of energy we consume using:
When the PV panels are not producing energy, there will not be any overproduction, and the total_consumption will be equal to the grid_consumption. When there is no grid_consumption and the PV panels are producing sufficient energy to meet the demand, the total_consumption is equal to the pv_production minus the pv_overproduction.
I’m interested in our dependence from the grid. This is then an easy next step:
dependence = grid_consumption / total_consumption
This gives me a number that gives me the amount of energy consumed from the grid related to the total consumption. Initially, I will calculate our dependence based on 30 minute intervals.
The good news is that I already have the data, but it’s spread over multiple time-series. I’m building a small service that consumes the required data from the time-series, computes the dependence, and writes it back into a new time-series for historic analysis.
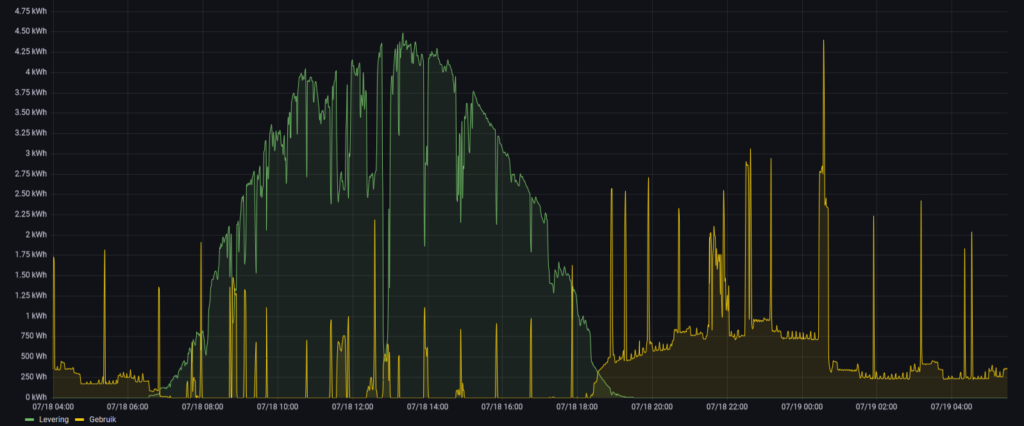
Grafana showing pv_overproduction (green) and grid_consumption(yellow).
When we decided we wanted to build a new house I wanted to invest in both passive and active technology to reduce our energy consumption as much as possible. My goal is to reduce our dependency from external energy sources, without installing batteries. This means I need to match our energy consumption with its (local) availability (or simply said: solar-powered production).
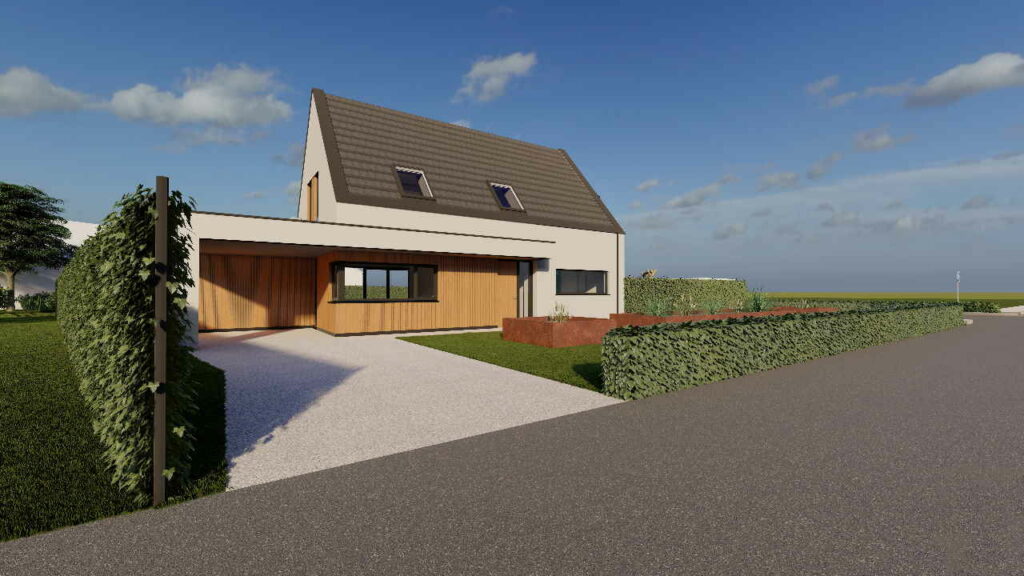
Impression of the design of our house.
Use case
The washer, dishwasher, and dryer are energy-consuming devices. We are used to start these devices at night: the energy was cheaper, there was no noise pollution in the living room, and it made sense at the end of the day.
At the same time, it doesn’t really matter when these devices finish their work. Typically you want them finished within the next 12 hours or so. Therefore, a smart system could nicely plan their consumption based on the next available solar-power production peak, which typically happens around lunch-time anyway. This would increase the energy we consume directly from the solar panels and reduce the energy we need to consume from the grid.
To make things a bit easier I decided to buy devices that support the B/S/H Home Connect system. As we are still building the house I don’t have a dishwasher and at the moment we don’t use a dryer, so I started with the washer.
Challenges
I need a lot of information to make this work. Luckily there are some public (free-of-charge) cloud-services available that helped me a bit here and there. All of the selected services have well documented APIs that I could implement with ease. My biggest challenge was to get the OAuth 2.0 Device Authorization flow up and running for Home Connect.
Appliance status to determine if there is a need to start a program.
[optional] Day-ahead energy pricing, in case the production is not sufficient to select an optimal (cost-efficient and grid-optimised) timeslot to consume energy from the grid.
In our current apartment I don’t have solar-panels. Therefore I’m using data from another (live) solar production site to simulate the behaviour of the concept.
System architecture
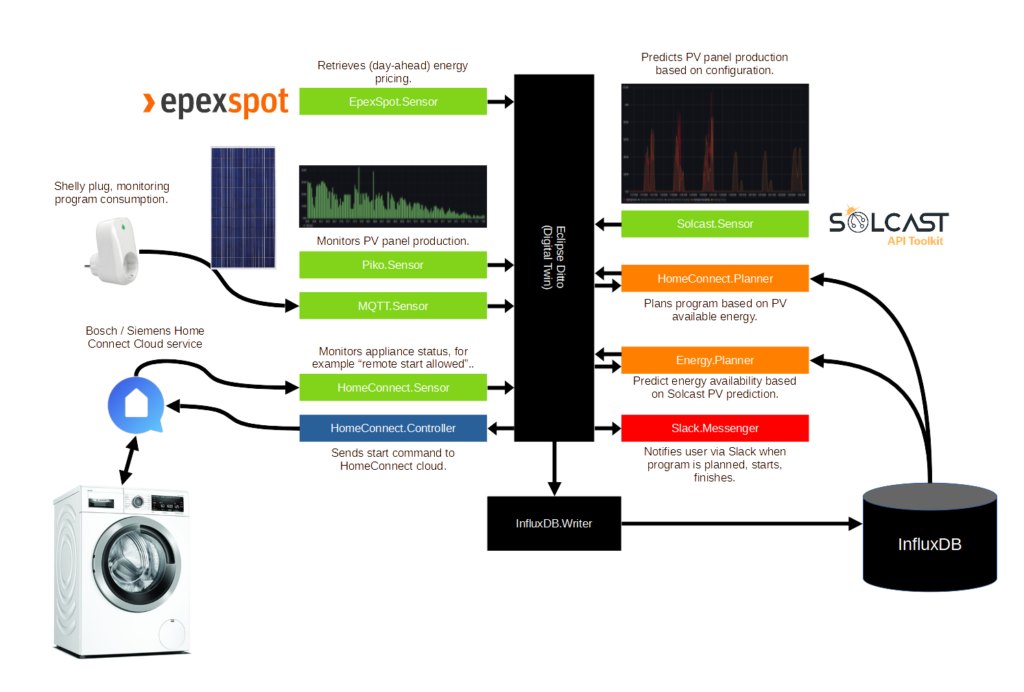
To manage expectations: I’m not a professional software engineer. I’m not planning to productise this, and just want to be able to maintain everything myself. I might publish some of the related projects on Github, but don’t expect a lot of documentation on it.
System architecture overview
The image below shows a high-level system architecture. I’m using Ditto as a local digital twin for capturing the current state of all the entities in the system. Additionally, I’m using InfluxDB to store the historical states of the digital twins and Grafana to visualise the historical states. The green services are “sensors”: they retrieve data from their sources and update the digital twin. The blue services are “controllers”: they control the devices based on the status of the digital twin. The orange services are “processors”: they transform data or decide to start actions. The red services are “communicators”: they communicate with the user of the specific use-case.
How to use it?
Well, that’s the good news. Instead of pressing the “start” button on the washer, we press the “remote start enabled” (or “app”) button. The HomeConnect.Sensor captures this event and updates the digital twin. The HomeConnect.Planner is subscribed to this update and starts calculating the best possible timeslot in the next 16 hours to start the program. It considers the predicted solar-panel production, the history washer program consumption registered by the Shelly Plug, and the Epex spot pricing. Once it has calculated the ideal start time updates the “scheduledprogram” digital twin. The HomeConnect.Controller is subscribed on this update and sends the start command to the washer based on the time HomeConnect.Planner has defined. Slack (using Slack.Messenger) keeps the user up-to-date on what is happening, for example, when the program is planned, started, finished, or cancelled.
Manage Cookie Consent
I use cookies to optimise my website and service.
Functional Always active
The technical storage or access is strictly necessary for the legitimate purpose of enabling the use of a specific service explicitly requested by the subscriber or user, or for the sole purpose of carrying out the transmission of a communication over an electronic communications network.
Preferences
The technical storage or access is necessary for the legitimate purpose of storing preferences that are not requested by the subscriber or user.
Statistics
The technical storage or access that is used exclusively for statistical purposes.The technical storage or access that is used exclusively for anonymous statistical purposes. Without a subpoena, voluntary compliance on the part of your Internet Service Provider, or additional records from a third party, information stored or retrieved for this purpose alone cannot usually be used to identify you.
Marketing
The technical storage or access is required to create user profiles to send advertising, or to track the user on a website or across several websites for similar marketing purposes.