
Context
Roughly 20% of Dutch homes is equipped with solar panels. In Germany the adoption rate of solar panels is roughly 11%. This means that these homes produce power locally, but they hardly use it at the same time when it’s being produced. Only 30% of the produced energy is consumed directly. That means that 70% of the energy consumption is still consumed from the grid.
Metrics
Considering my own installation the numbers are even worse. Only ~20% of the locally produced (10mWh) energy is directly consumed (2Mwh). The real problem is that almost 80% of the consumed energy is consumed from the grid.
Vision
In 2026, three years from now, I want to reduce my grid consumption to 50% (on average, per year).
I have no idea if this is achievable, but it’s good to have a concrete goal. If I figure out I can achieve this in one year, I will increase my ambition.
In order to achieve this vision, I need to increase the direct consumption which will result in a decrease of overall grid consumption.
Steps along the way
To reach this vision, I need to understand at which times energy is already directly consumed and which consumers are causing this consumption. Additionally, I need to understand when energy is consumed from the grid and which consumers are causing this consumption. I’m hoping that, by influencing the consumption patterns of the largest consumers, I can make the first large step.
| Year | Grid consumption | Direct consumption |
| 2023 (today) | 80% | 20% |
| 2024 | 60% | 40% |
| 2025 | 53% | 47% |
| 2026 | 50% | 50% |
I expect that the first major improvements will already start paying off in 2024. I’m aiming for a 20% increase in 2024 over 2023. Then the real challenge will probably start.
First analysis of available data
In the first half of the year my system was still in development. After that is has become more stable, which resulted in a stable data collection since June.
When is direct consumption low?
At this moment I considered one interesting data points per week:
- Direct consumption (%) = direct consumption / total production (solar);
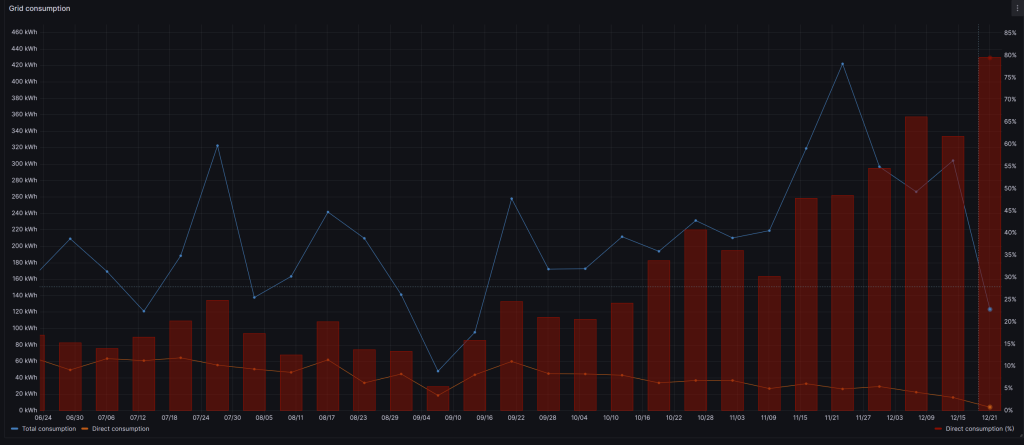
Considering the available data I should start trying to focus on the summer months when solar production is high.
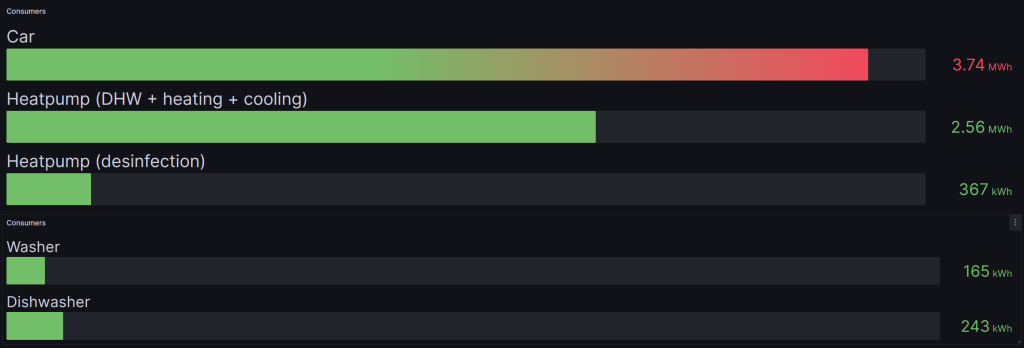
Which are the largest consumers?
Let’s have a look at the usual suspects fist: the car, heatpump, washer, and dishwasher.
Next steps
Considering my vision and the available data I should focus on moving grid consumption for the car and heatpump to direct consumption, especially in the summer months. I will share concrete objectives and key-results for this in a next post.